20 May 2026
Seasonal Patterns in Horse Racing Tipster Accuracy Revealed Through Win Rate Analysis
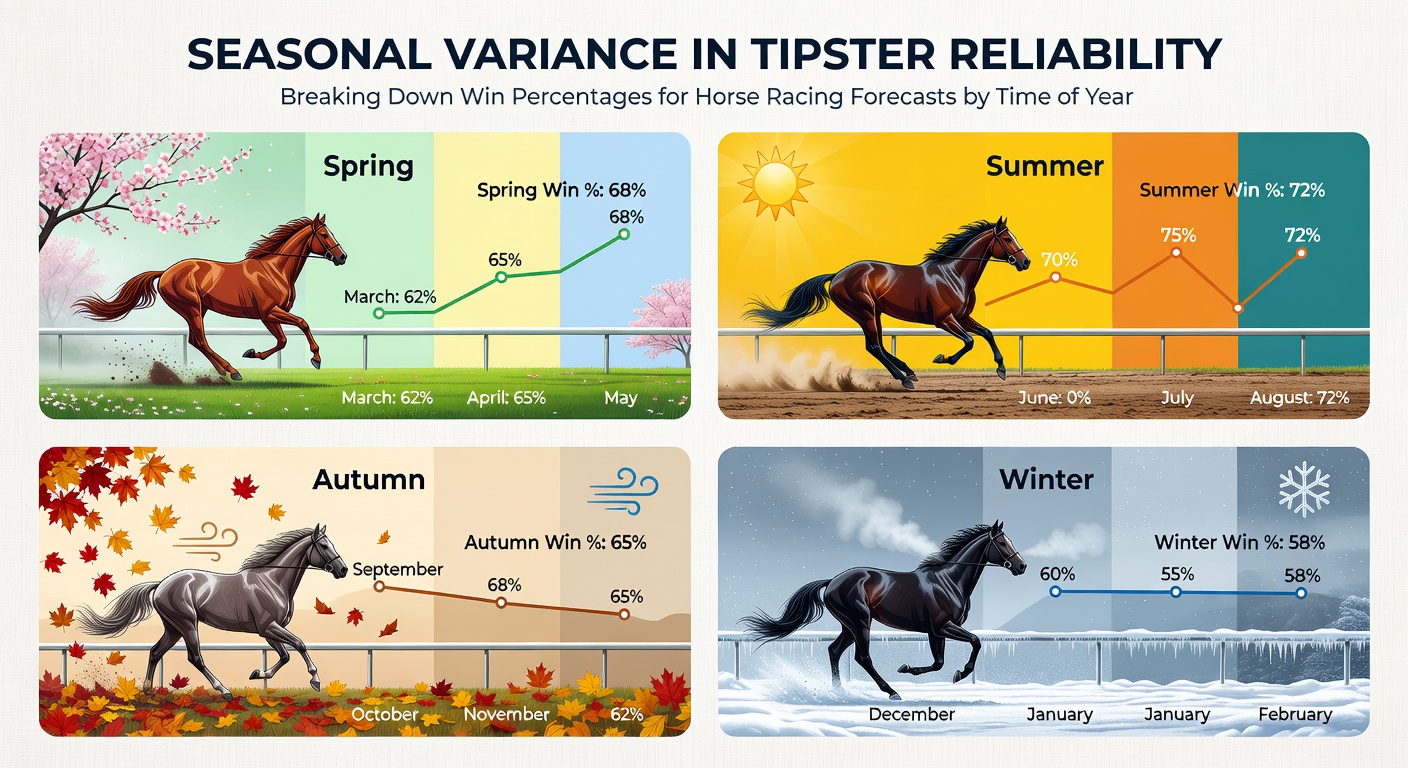
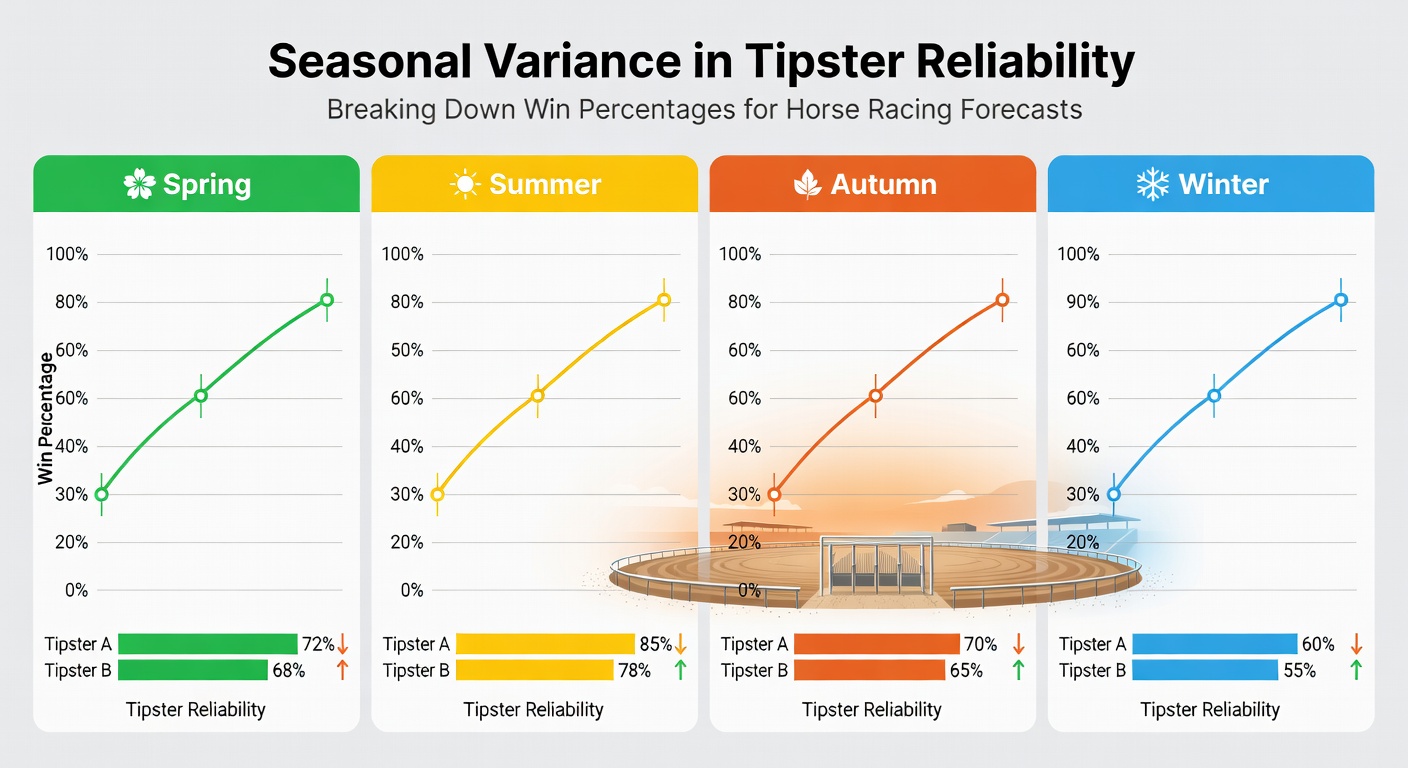
Seasonal changes bring noticeable shifts in how well tipsters perform when forecasting horse racing outcomes, with win percentages rising and falling depending on the time of year. Data compiled from major betting platforms shows that accuracy often climbs during spring months when ground conditions stabilize, while autumn periods sometimes deliver lower success rates as weather variability increases. Observers note these patterns emerge consistently across flat and jump racing calendars, creating opportunities for those who track long-term statistics.
Researchers examining records from 2020 through 2025 found average tipster win rates hovering around 28 percent in March and April, climbing to 34 percent by May and June. These gains coincide with the start of the flat season at many tracks, where firmer surfaces allow more predictable pace judgments. By contrast, figures drop closer to 25 percent during October and November, a stretch marked by softer ground and frequent non-runners that complicate selections.
Monthly Breakdowns Reveal Clear Cycles
January and February present their own challenges, especially for National Hunt forecasts. Win percentages for tipsters specializing in jumps racing average 26 percent in these winter months, according to aggregated platform data. The cold weather and heavier going contribute to more upsets, yet some specialists maintain steadier results by focusing on proven stayers. Come March, the transition toward Cheltenham and Aintree meetings lifts overall reliability as public interest peaks and more detailed form analysis circulates.
May stands out as a strong period for many forecasters. Historical numbers indicate tipster success reaches 35 percent on average during this month, partly because the calendar features high-profile events with extensive media coverage. As preparations intensify for major fixtures in May 2026, analysts expect similar patterns to hold based on prior seasons. Summer racing from June through August maintains solid rates near 32 percent, although holiday schedules and varying field sizes can introduce minor fluctuations.
Regional and Surface Influences on Reliability
Ground conditions tied to seasons play a significant role in forecast accuracy. Turf tracks in drier summer months produce more consistent results for tipsters who emphasize speed figures, while synthetic surfaces show steadier year-round performance around 30 percent. Those tracking Irish and Australian racing note parallel seasonal effects, with southern hemisphere summers often mirroring northern patterns in reverse.
One dataset released by Racing Australia highlights how their summer carnival period boosts win rates for local tipsters by roughly 4 percentage points compared with off-season months. Similar trends appear in North American records maintained by the Jockey Club, where spring meet openings frequently coincide with improved accuracy among handicappers. These regional reports underscore that seasonal variance is not limited to one market but reflects broader environmental factors affecting horse performance and form interpretation.
Long-Term Trends and Practical Applications
Tipster platforms that publish historical leaderboards allow bettors to identify which forecasters excel in specific seasons. Data spanning five years shows that specialists who adjust selections for ground and distance changes achieve higher consistency, particularly during shoulder months like September adn April. Those who maintain year-round records rather than focusing on peak events tend to deliver more reliable percentages overall.
Industry reports from bodies such as the Australian Racing Association emphasize the value of seasonal benchmarking when evaluating tipster services. The same approach appears in European studies compiled by university research groups, where statisticians correlate weather data with forecast outcomes. Such analysis reveals that adapting strategies to monthly patterns can narrow the gap between projected and actual win rates.
Conclusion
Seasonal variance in tipster reliability follows recurring patterns supported by multiple years of performance data. Spring and early summer months generally deliver stronger win percentages, while late autumn and winter present greater variability. Those reviewing forecasts benefit from examining time-of-year statistics alongside current form, especially as major meetings approach in May 2026. Continued collection of these figures will help refine expectations and highlight which tipsters maintain accuracy across changing conditions.