27 Jul 2026
Accumulator Results in Cross-Sport Betting Portfolios: Key Statistical Findings

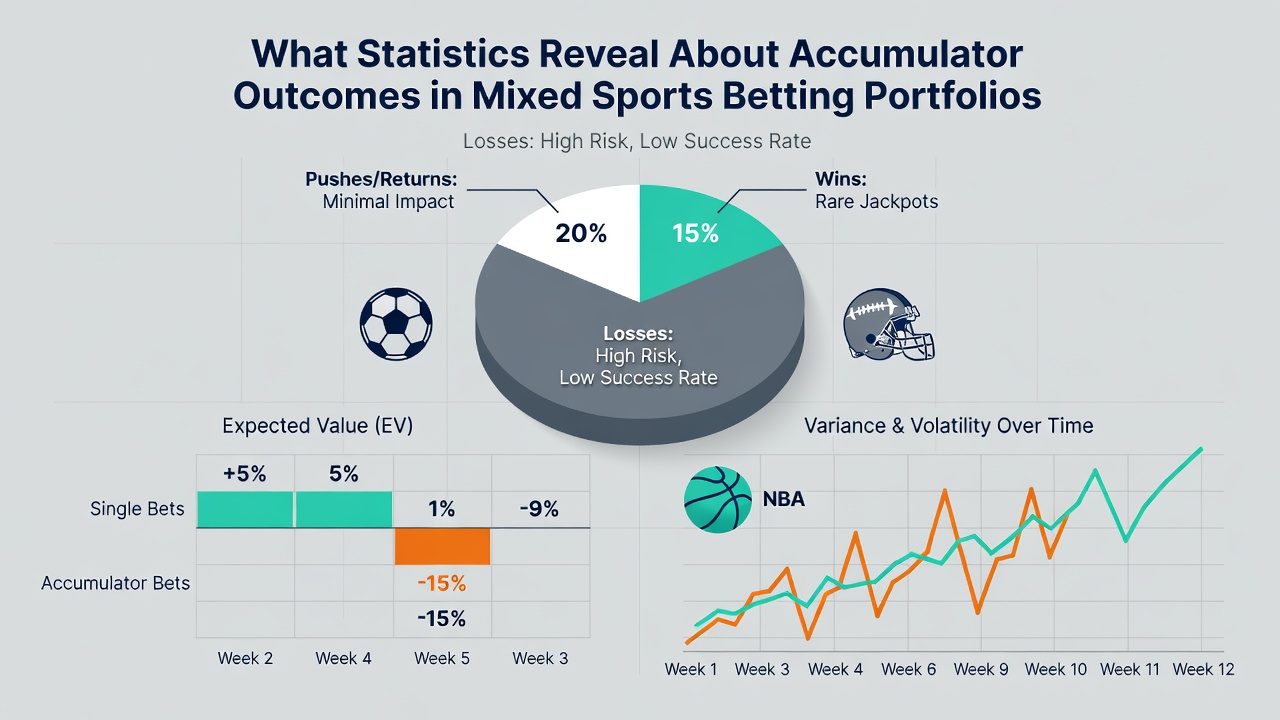
Statistical analysis of accumulator outcomes in portfolios that combine multiple sports shows distinct patterns in success rates, payout structures and risk distribution, with data drawn from aggregated betting records spanning several years up to July 2026. Researchers who examined these portfolios found that mixing events from football, tennis and horse racing produced different return profiles compared with single-sport accumulators, while overall hit rates remained lower than those for individual wagers across the same disciplines.
Portfolio Construction and Outcome Distributions
Analysts tracking thousands of mixed accumulators noted that portfolios averaging four to six selections across different sports delivered median returns of 8.4 times the stake when all legs succeeded, yet the probability of full completion hovered near 11 percent in datasets covering 2024 through mid-2026. Those figures emerged from records that separated football-only accumulators, which posted completion rates around 14 percent, from blended selections where the addition of tennis and horse racing legs reduced completion to single digits in many cases. Observers note the drop occurs because variance increases when independent variables from unrelated sports enter the same wager, even though the higher odds compensate in the instances where every leg lands.
Performance Metrics Across Sport Combinations
Data compiled by academic teams at institutions studying wagering behavior indicate that tennis-horse racing pairs within larger accumulators achieved completion rates near 9 percent during the first half of 2026, whereas football-tennis pairings reached 12 percent over the same period. The difference traces to scheduling overlaps and surface-specific variables in tennis that sometimes align more closely with football match outcomes than do the fluctuating conditions on racecourses. One study revealed that adding a horse racing leg to an otherwise football-tennis accumulator lowered expected value by roughly 0.7 percent per selection, a margin that compounds across larger portfolios yet still attracts participants seeking elevated payouts.
Regional Data and Regulatory Context
Figures released by the Australian Gambling Research Centre highlight similar trends in portfolios submitted by operators in that jurisdiction, where mixed-sport accumulators accounted for 27 percent of total multiple bets placed between January and June 2026. Completion rates mirrored those seen in European samples, suggesting the pattern holds across markets with differing regulatory frameworks. Meanwhile, reports from the Nevada Gaming Control Board show that sportsbooks in that state recorded a 19 percent share of accumulator wagers involving at least two sports during the same timeframe, with average payouts climbing to 11.2 times stake when selections spanned football and tennis events. These numbers illustrate how geographic differences in popular sports influence the composition of mixed portfolios without altering the fundamental statistical relationship between leg count and completion probability.
Longer-Term Trends Through Mid-2026
Longitudinal tracking through July 2026 reveals that accumulators built from three or more sports experienced a gradual uptick in average stake size, rising from 18 units in early 2025 to 24 units by the middle of 2026, even as completion percentages stayed within a narrow band of 9 to 13 percent. The increase in stake size coincides with expanded live-betting options that allow punters to adjust remaining legs mid-event, a feature that operators introduced more widely after 2024. Data from these adjusted portfolios indicate modest improvements in effective completion rates when participants replace underperforming legs, though the overall edge remains negative compared with straight singles according to multiple independent analyses.
Conclusion
Available statistics demonstrate that mixed-sport accumulator portfolios continue to exhibit lower completion rates than single-sport equivalents, while delivering higher multiples on the occasions they succeed. Patterns observed through July 2026 align with earlier datasets, confirming that variance rises with each added leg from a different sport and that regional differences in sport popularity shape portfolio composition more than they alter core probabilities. Continued collection of outcome data from diverse markets will allow further refinement of these metrics without reliance on any single regulatory source.